Discover How Traders Are Able
To Pinpoint Order Flow Based Trades With This Simple Tool.
To Pinpoint Order Flow Based Trades With This Simple Tool.
See How It Works In The Video Below...

My name is Michael Valtos and I spent 20 years as an institutional trader at JP Morgan, Cargill, Commerzbank, EDF Man and Dean Witter Reynolds. The one thing that I have found to be single most important part of market analysis is order flow because it gets you as close to the market as possible.
One of the reasons many traders fail is because they don't take into account volume and how it is trading. They incorrectly treat all traded prices the same. We can see in the order flow that volume has a direct impact on price activity.
Order flow is the missing link for many traders because it allows them to understand what is really happening in the market. Analyzing order flow lets a trader know how trade is being facilitated in any direction.
Not all traded prices are going to be the same. The one thing that defines the importance of a price level is market participation. Good price levels are those where traders were able to transact good volume with each other. It is an active level. These are the levels that matter to FlowBreaks.
Knowing the price levels in a bar where there is heavy participation is just part of the analysis. The next step is put those price levels in context of the market and price action. Is the market and more importantly volume migrating higher or lower.
Markets are curious and are always looking for new price levels to facilitate trade around. Traders love to try and high or low tick the market to trick the market into thinking that the market wants to break out. These are false moves which fail. The true moves happen when there is volume behind them.
How the market is trading right now does affect what will happen next.
We have all heard the question "which came first, the chicken or the egg?"
In trading, there is a similar question, which came first in a move, volume or price? Let's think about it for a moment. Price moves on aggressive trading. The aggressive buyers have to outnumber the passive sellers the make price move higher. Just as the aggressive sellers have to outnumber the passive buyers for price to move lower. So it is volume. The aggressive volume has to be stronger than the passive volume.
But it is not just about the direction of the aggressive volume. Passive volume needs to follow the aggressive volume. What this means is when the market is moving up and aggressive buyers start clearing out the passive sellers, what you want to see is the passive buyers come in to support the market so that the move that is starting does not retrace back.
The opposite is true for a move down. Aggressive sellers come in and take out the passive buyers (the bids), but you also want to see the passive offers come in at the levels that we just saw had passive buyers. So not only is the market clearing out the bids, but also the market is now coming in and filling in with strong offers to give the market resistance to prevent a retrace back up.
- Runs on NinjaTrader 8 and takes about 15 seconds to install.
- Runs smoothly & efficiently without the need for tick replay.
- Signals do not repaint, once they appear and the bar closes, the signals remain.
- Pulls information from the order flow without the need for a footprint chart.
Check Out Some Charts From The Last Few Days!
CL (Crude Oil) 1-minute chart

UB (Ultra Bond) 1-minute chart

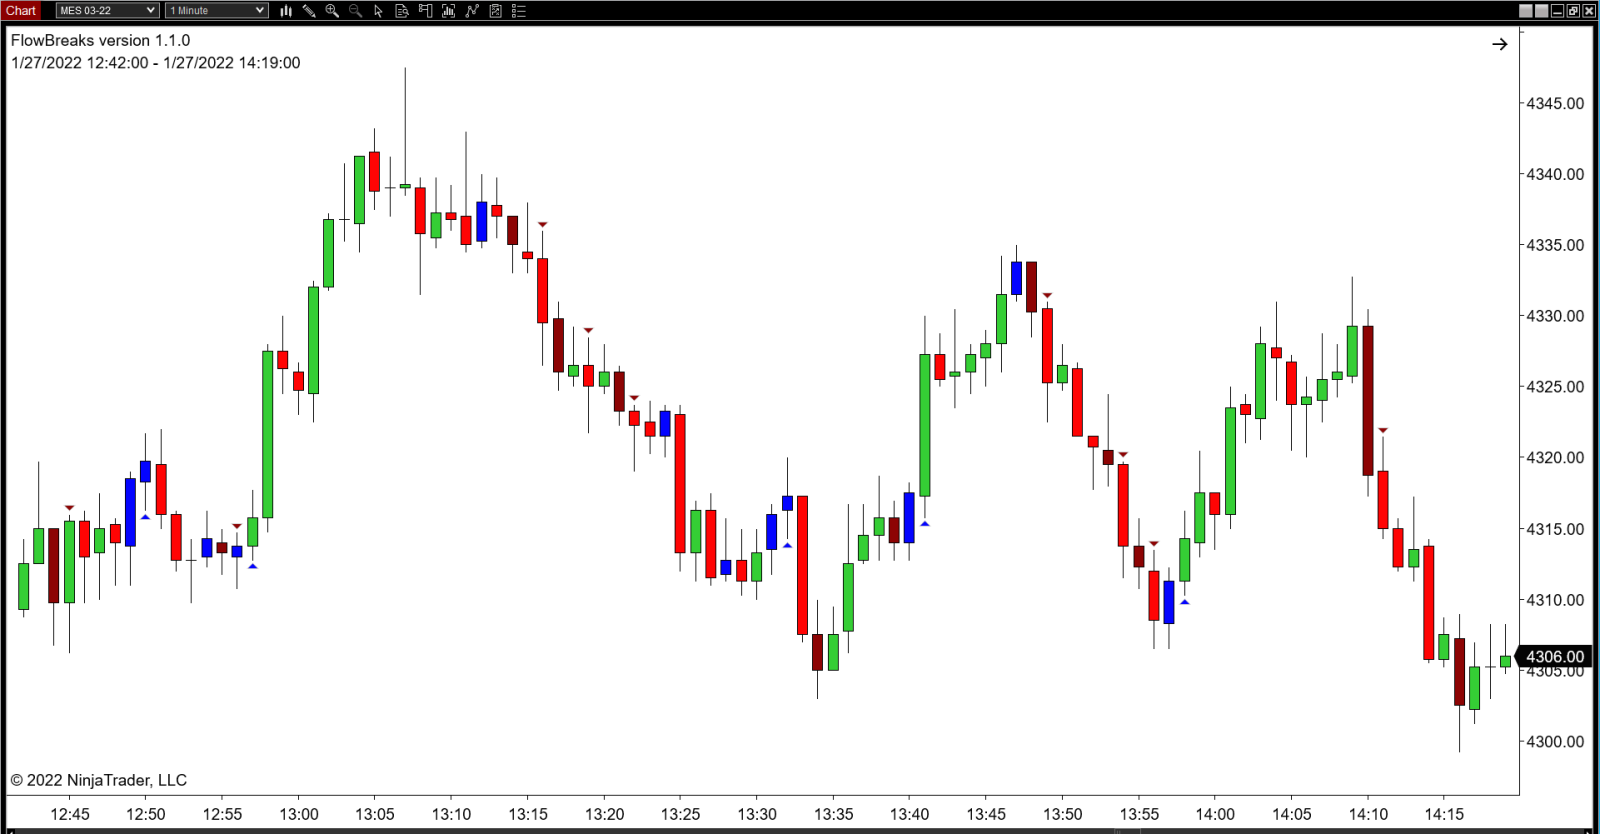
MES (Micro E-mini) 1-minute chart

ZS (Soybeans) 1-minute chart

6E (Eurocurrency) 1-minute chart

FESX (EuroStoxx) 1-minute chart

Order flow is robust with the amount of information it provides a trader. Order flow allows a trader to not only see the intensity of trading that is taking place. But more importantly, order flow allows a trader to judge the strength of trading and determine if it is getting stronger or weaker.
The problem many traders face with approaching order flow is trying to make sense of it. It is difficult because there are so many nuances to it. That is why I created the FlowBreaks indicator, to help you see things in the order flow that other traders don't see.
The problem many traders face with approaching order flow is trying to make sense of it. It is difficult because there are so many nuances to it. That is why I created the FlowBreaks indicator, to help you see things in the order flow that other traders don't see.
Stop Wasting Time & Money Trying To Figure Out
How It All Works, And Start Succeeding Now!
How It All Works, And Start Succeeding Now!
FlowBreaks does all the order flow analysis for you and shows you were the market is starting to break out based on volume. There are many order flow break outs during the trading day for a trader to take advantage of, they don't just occur at support and resistance. FlowBreaks can be used to find momentum as well as reversals.
Get FlowBreaks now for $497
Clicking on the order link will redirect you to our secure payment processor page on PayPal.
Please allow 3 to 6 hours for us to process your order. We will email you all the necessary files as soon as your order is processed.
Please allow 3 to 6 hours for us to process your order. We will email you all the necessary files as soon as your order is processed.
Wanna See More Charts?
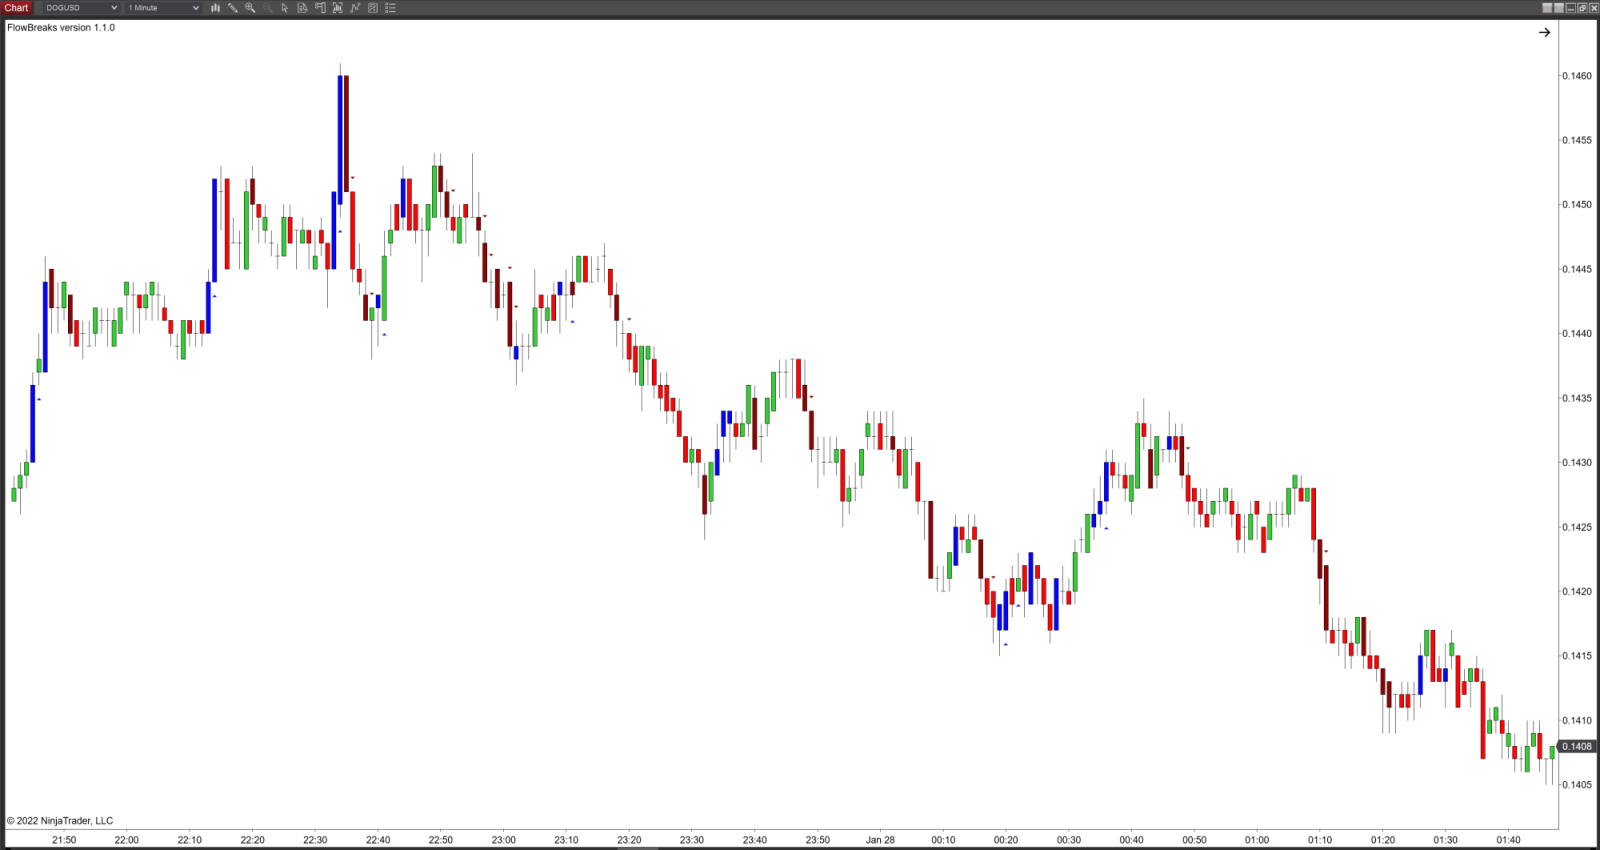
DOGE Crypto

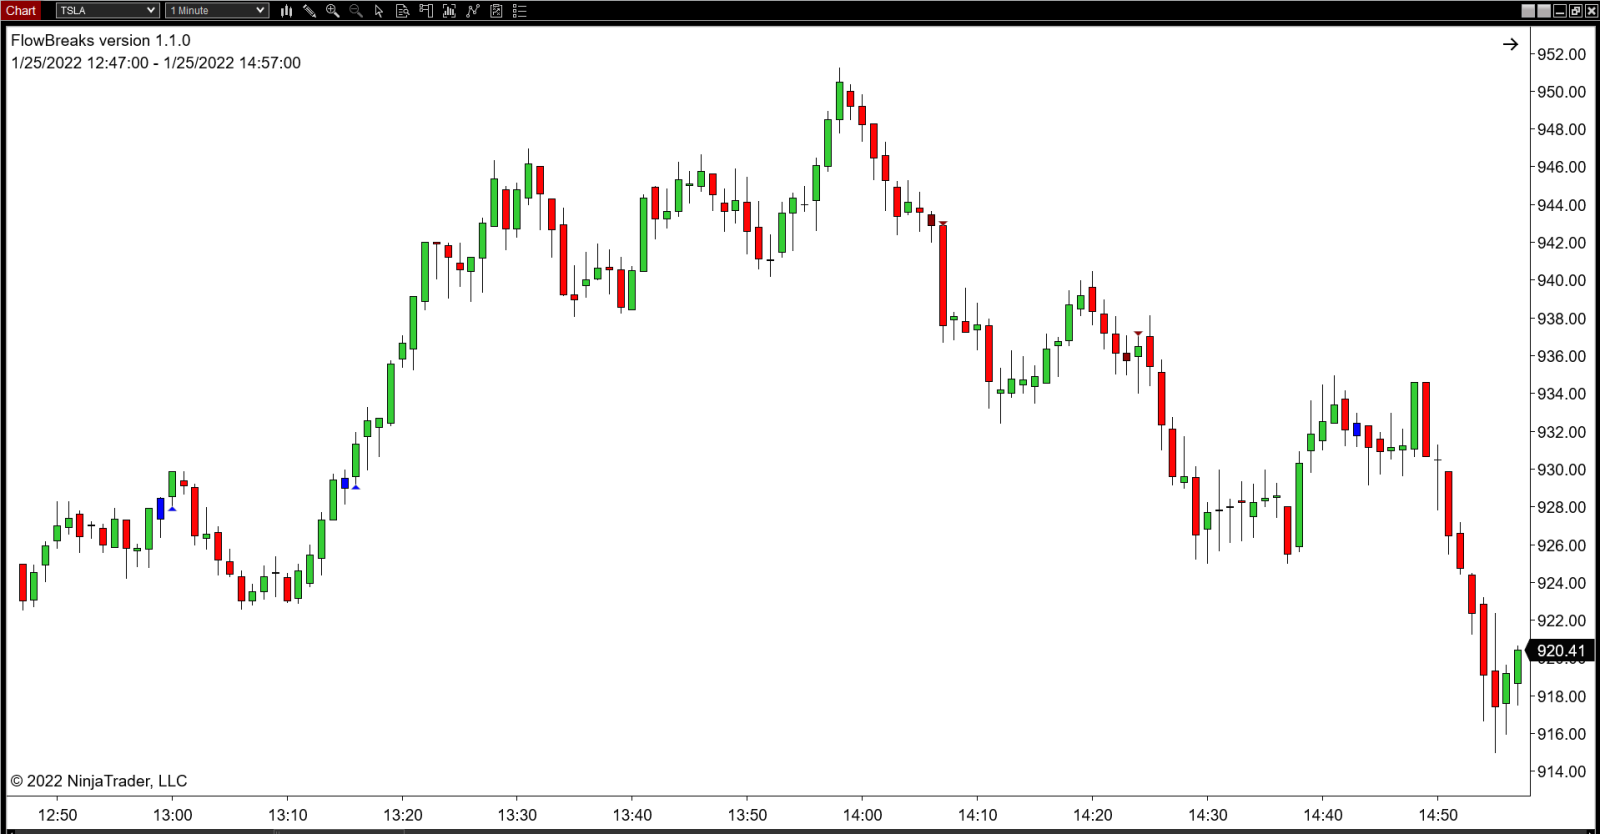
TSLA (Tesla Stock)

AAPL (Apple Stock)

AMZN (Amazon Stock)

EURGBP

AUDUSD

Overnight Sessions Can Also Be Traded
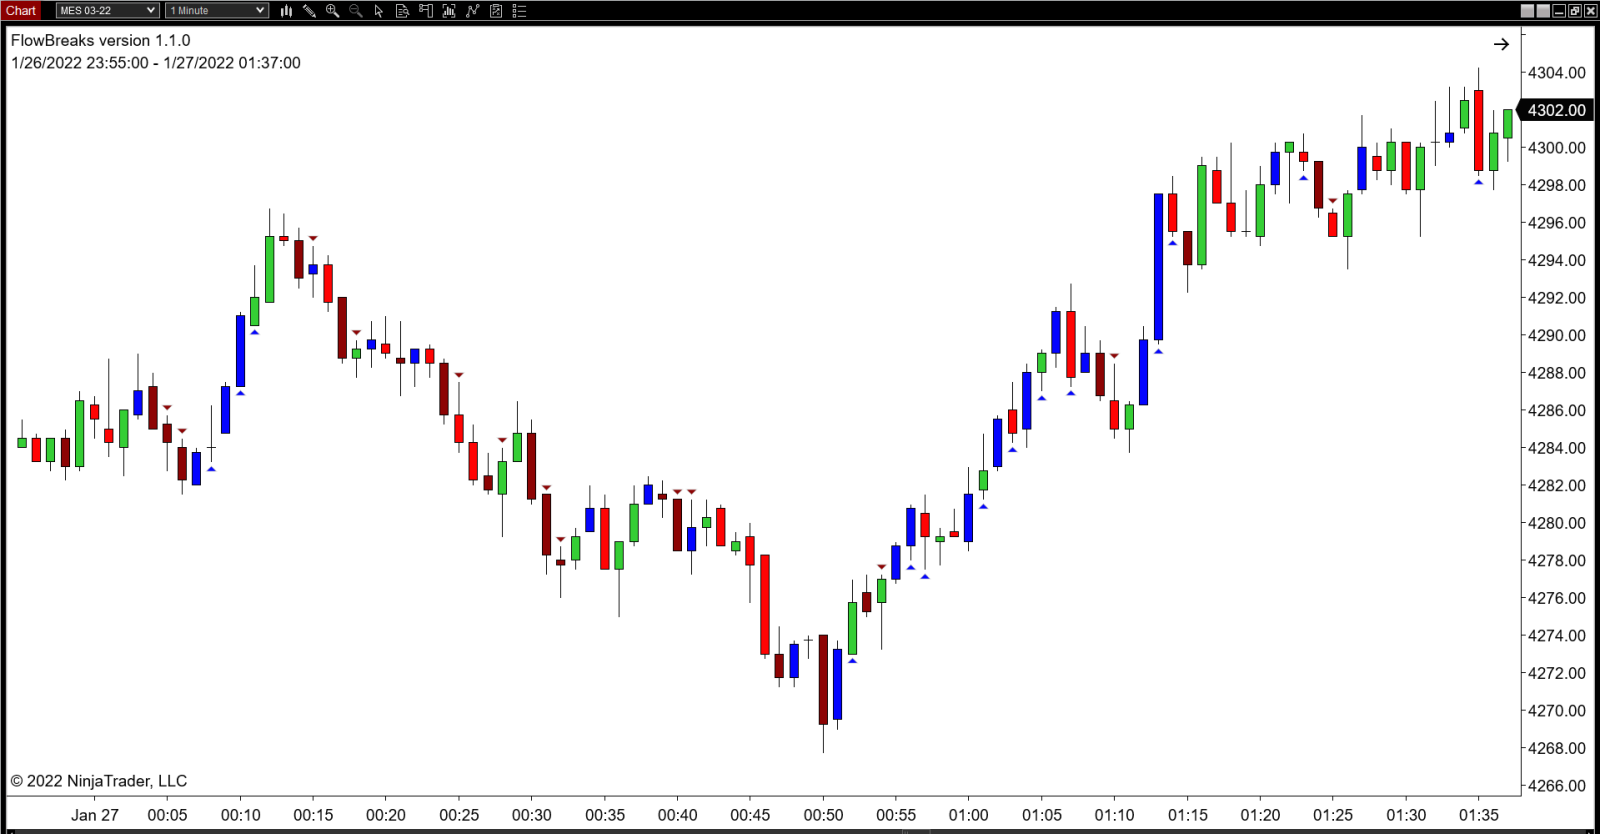
MES (Micro E-mini Futures) On London Open

GC (Gold Futures) During Asian Hours

Frequently Asked Questions
Q. I Already Have Some Of Your Other Indicators Like Powerbars, Flowshifts & Flowscalper. Is FlowBreaks The Same Thing?
A. No, FlowBreaks Is A New And Innovative Way To Measure Order Flow Data That No Other Order-Flow Indicator Has Been Able To Analyze.
Q. Is FlowBreaks A Footprint Chart?
A. No. FlowBreaks Is An Order Flow Tools That Analyzes All The Data
You Would Normally See On A Footprint Chart So Yo Don't Need To Use A Footprint Chart. I Created FlowBreaks Specifically So You Don't Need To Use A Footprint Chart.
Q. Do I Need A Footprint Chart To Use The FlowBreaks?
A. No, The FlowBreaks Run On Normal Bar Or Candlestick Chart And Don't Run On Footprint Charts.
Q. Does The FlowBreaks Run On A Footprint Chart?
A. No, FlowBreaks Does Not Run On A Footprint Chart.
Q. What Platform Does The FlowBreaks Work On?
A. FlowBreaks Is Programmed For NinjaTrader 8.
Q. Do I Need The PAID Version Of NinjaTrader 8 Or Can I Use The FREE Version?
A. FlowBreaks Will Run On The PAID Version As Well As The FREE Version Of NT8. But You Will Need A Real-Time Data Feed.
Q. Is FlowBreaks Easy To Set Up?
A. Yes, FlowBreaks Is Very Easy To Set Up. It Takes About 15 Seconds. There Is A Video In The Download Section That Takes You Through The Installation Process.
Q. I Use Sierra Chart, Is FlowBreaks Available For Sierra Chart?
A. No. At The Moment FlowBreaks Is Only Available For NT8.
Q. I See You Have Different Markets And Different Time Frames, Do I Need To Follow So Many Different Markets?
A. No, I Show You Different Markets And Different Chart Types So You Can See For Yourself How FlowBreaks Works Under Different Conditions.
Q. I Trade Forex, Can I Use FlowBreaks To Analyze FX Markets?
A. Yes. FlowBreaks Works On Forex Charts.
Q. I Trade Crypto, Can I Use The FlowBreaks To Analyze Crypto Markets?
A. Yes, NinjaTrader Can Connect To Coinbase For Free Crypto Data Which Can Be Used With FlowBreaks.
Q. What Markets Work Best With FlowBreaks?
A. Futures And Stocks Work Best With The FlowBreaks.
Q. What Time Frame Is Best For FlowBreaks?
A. Order Flow In Generally Is Best For Shorter Time Frames. If You Trade Anything From 30 Second Charts To 5-Minutes, FlowBreaks Performs Well. When Analyzing Order Flow It Is Best To Trade Off That Information As Soon As It Appears.
Q. What Chart Type Do You Recommend For FlowBreaks?
A. There Are Many Different Types Of Charts Available To Traders. I Suggest Short Term Charts, Such As 30-Second Or 1-Minute Charts. I Also Recommend Tick Based Charts And Volume Based Charts. I Explain Many Of The Different Chart Types In The User Guide And Take You Through The Settings For Those Charts And Markets.
Q. Are There Instructions On How To Use FlowBreaks?
A. Yes. There Is A Very Detailed And In Depth User Guide As Well As Instruction Videos.
All Rights Reserved - Orderflows.com & Flowbreaks.com - Copyright 2022
CFTC Rules 4.41:
Hypothetical or Simulated performance results have certain limitations, unlike an actual performance record, simulated results do not represent actual trading. Also, since the trades have not been executed, the results may have under-or-over compensated for the impact, if any, of certain market factors, such as lack of liquidity. Simulated trading programs in general are also subject to the fact that they are designed with the benefit of hindsight. No representation is being made that any account will or is likely to achieve profit or losses similar to those shown.
Disclaimer:
This presentation is for educational and informational purposes only and should not be considered a solicitation to buy or sell a futures contract or make any other type of investment decision. Futures trading contains substantial risk and is not for every investor. An investor could potentially lose all or more than the initial investment. Risk capital is money that can be lost without jeopardizing ones financial security or life style. Only risk capital should be used for trading and only those with sufficient risk capital should consider trading. Past performance is not necessarily indicative of future results.
Risk Disclosure:
Futures and forex trading contains substantial risk and is not for every investor. An investor could potentially lose all or more than the initial investment. Risk capital is money that can be lost without jeopardizing ones’ financial security or life style. Only risk capital should be used for trading and only those with sufficient risk capital should consider trading. Past performance is not necessarily indicative of future results.
Hypothetical Performance Disclosure:
Hypothetical performance results have many inherent limitations, some of which are described below. no representation is being made that any account will or is likely to achieve profits or losses similar to those shown; in fact, there are frequently sharp differences between hypothetical performance results and the actual results subsequently achieved by any particular trading program. One of the limitations of hypothetical performance results is that they are generally prepared with the benefit of hindsight. In addition, hypothetical trading does not involve financial risk, and no hypothetical trading record can completely account for the impact of financial risk of actual trading. for example, the ability to withstand losses or to adhere to a particular trading program in spite of trading losses are material points which can also adversely affect actual trading results. There are numerous other factors related to the markets in general or to the implementation of any specific trading program which cannot be fully accounted for in the preparation of hypothetical performance results and all which can adversely affect trading results.
Thanks for subscribing. Share your unique referral link to get points to win prizes..
Loading..


